Disproportionate treatment can occur at each stage of a criminal legal case, from arrest through sentencing, and beyond. “Cumulative disproportionality” reflects all the decisions made up to that point in time.
AEJG built and maintains these Equity Dashboards to help you consider how each choice in the life of a criminal case may contribute to, reflect, or help resolve disproportionality and inequity. To start, explore our data sources or select a use case to learn more about the Equity Dashboard types.
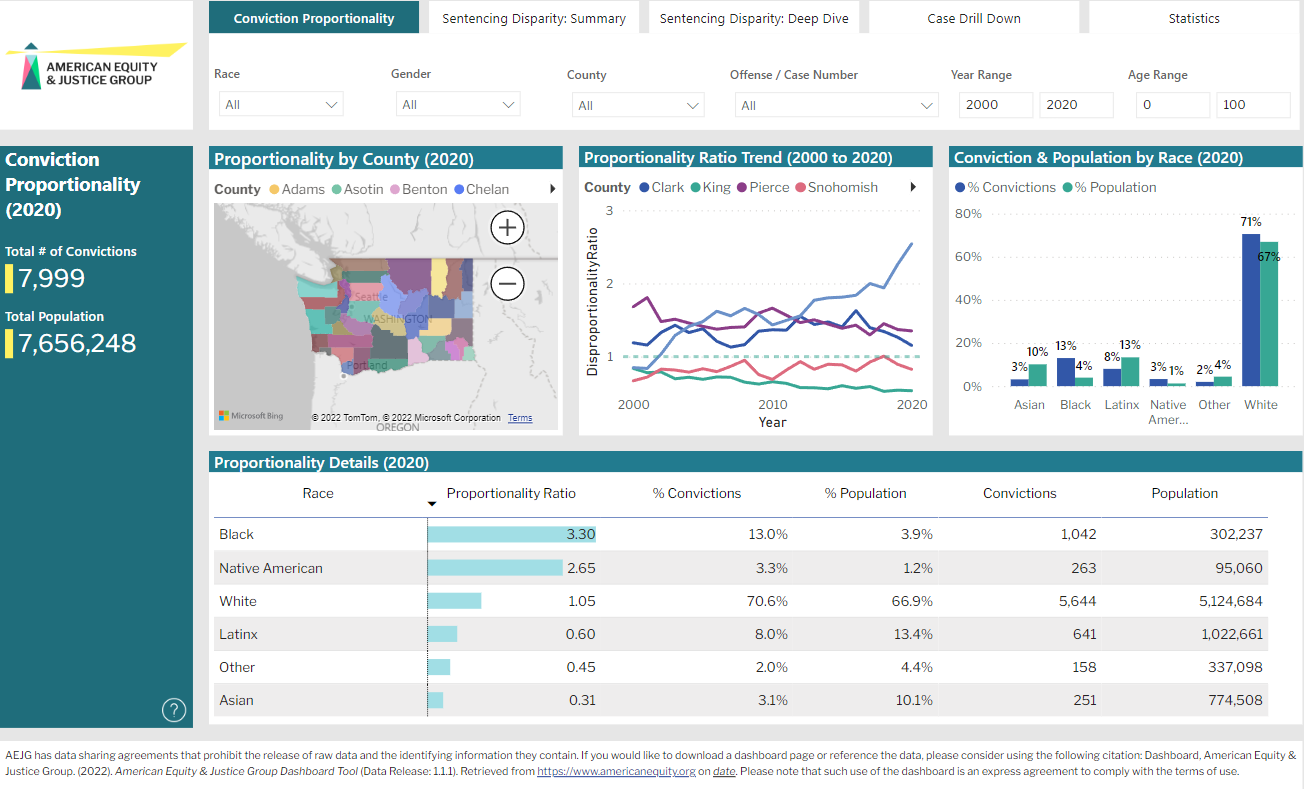
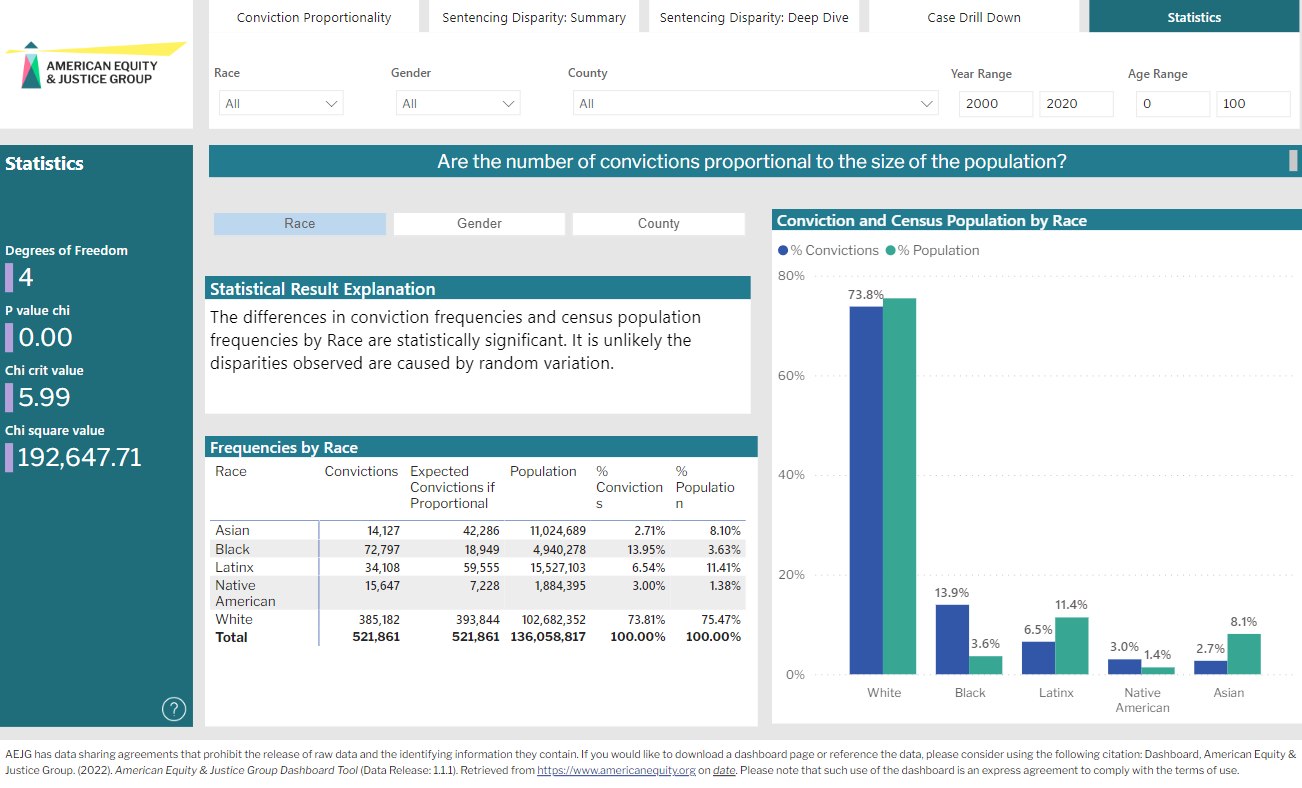
Governments, nonprofit organizations, and businesses rely on the U.S. population information provided decennially through the Census. Over time, the Census Bureau has changed the way it classifies race and ethnicity. Historically, the changes have been influenced by social, political and economic factors including emancipation, immigration and civil rights. More information can be found at www.census.gov.
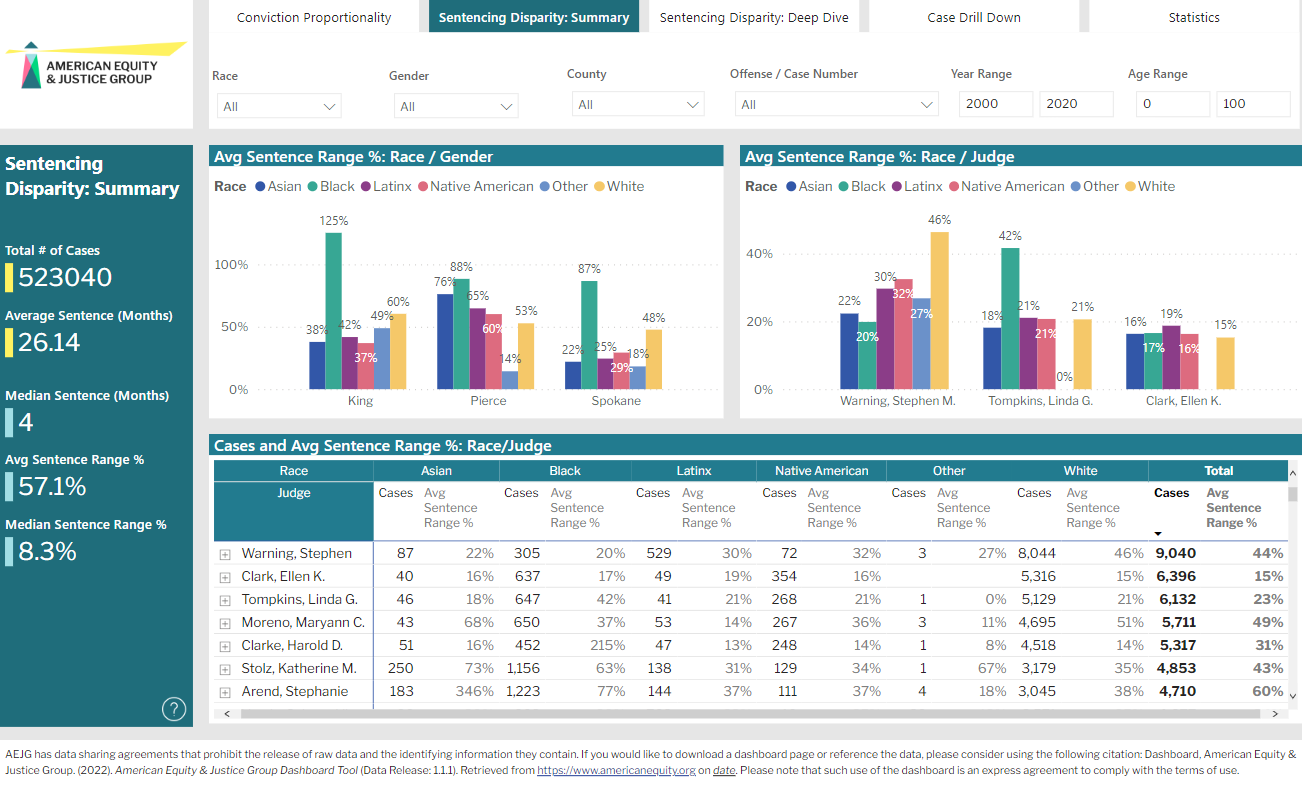
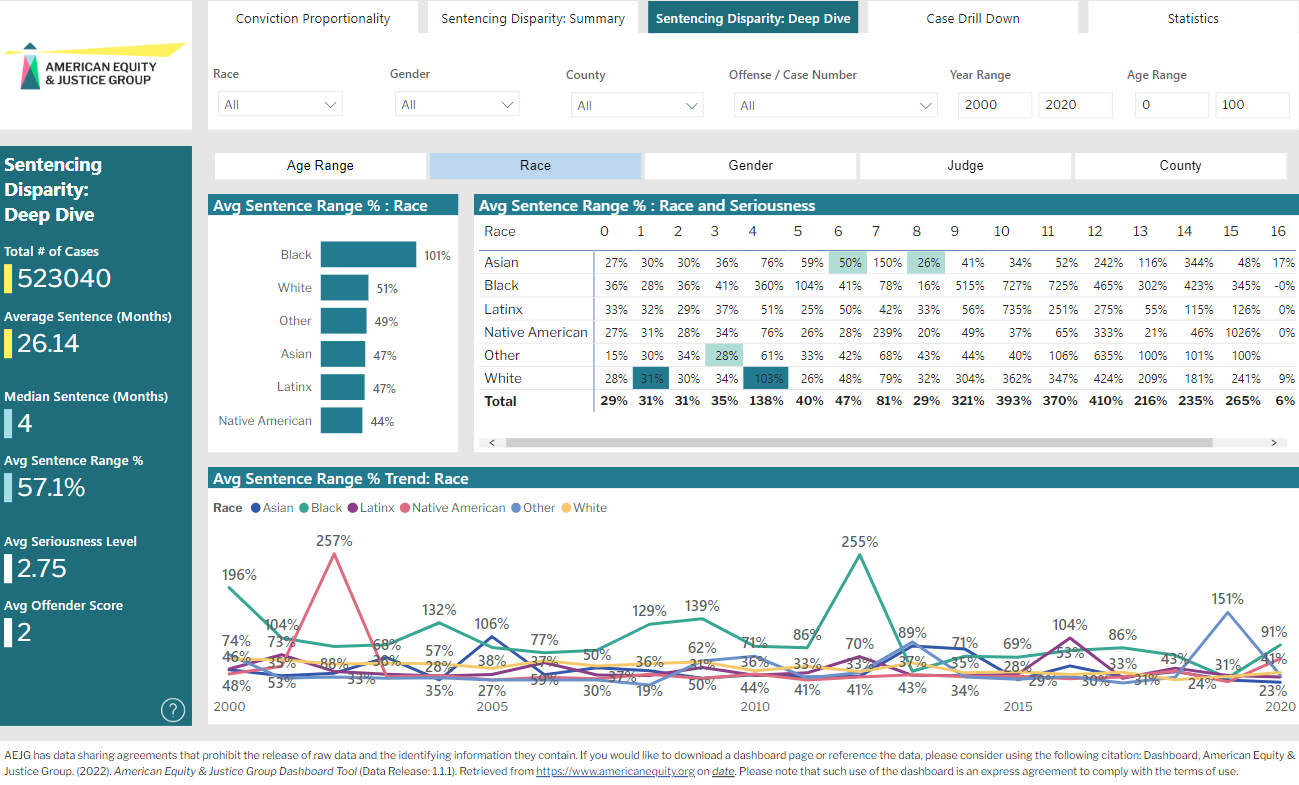
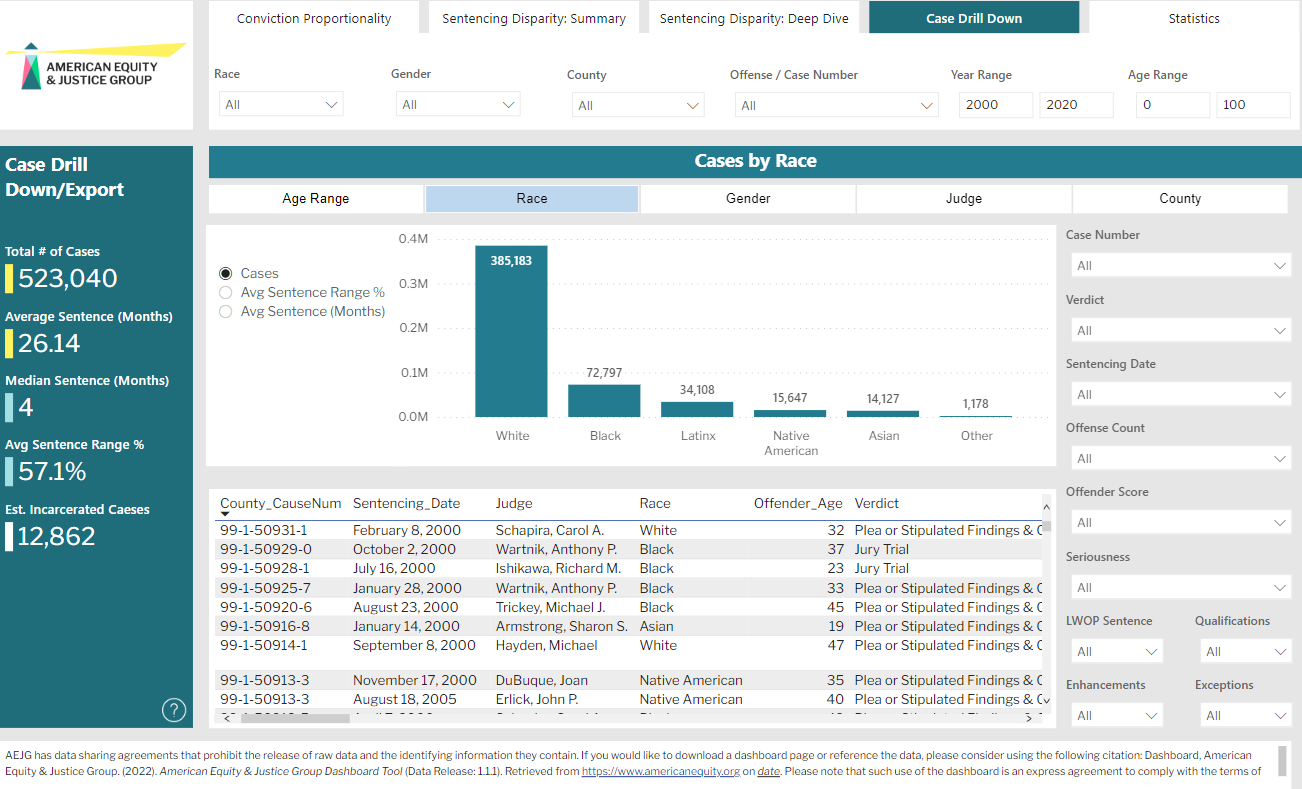
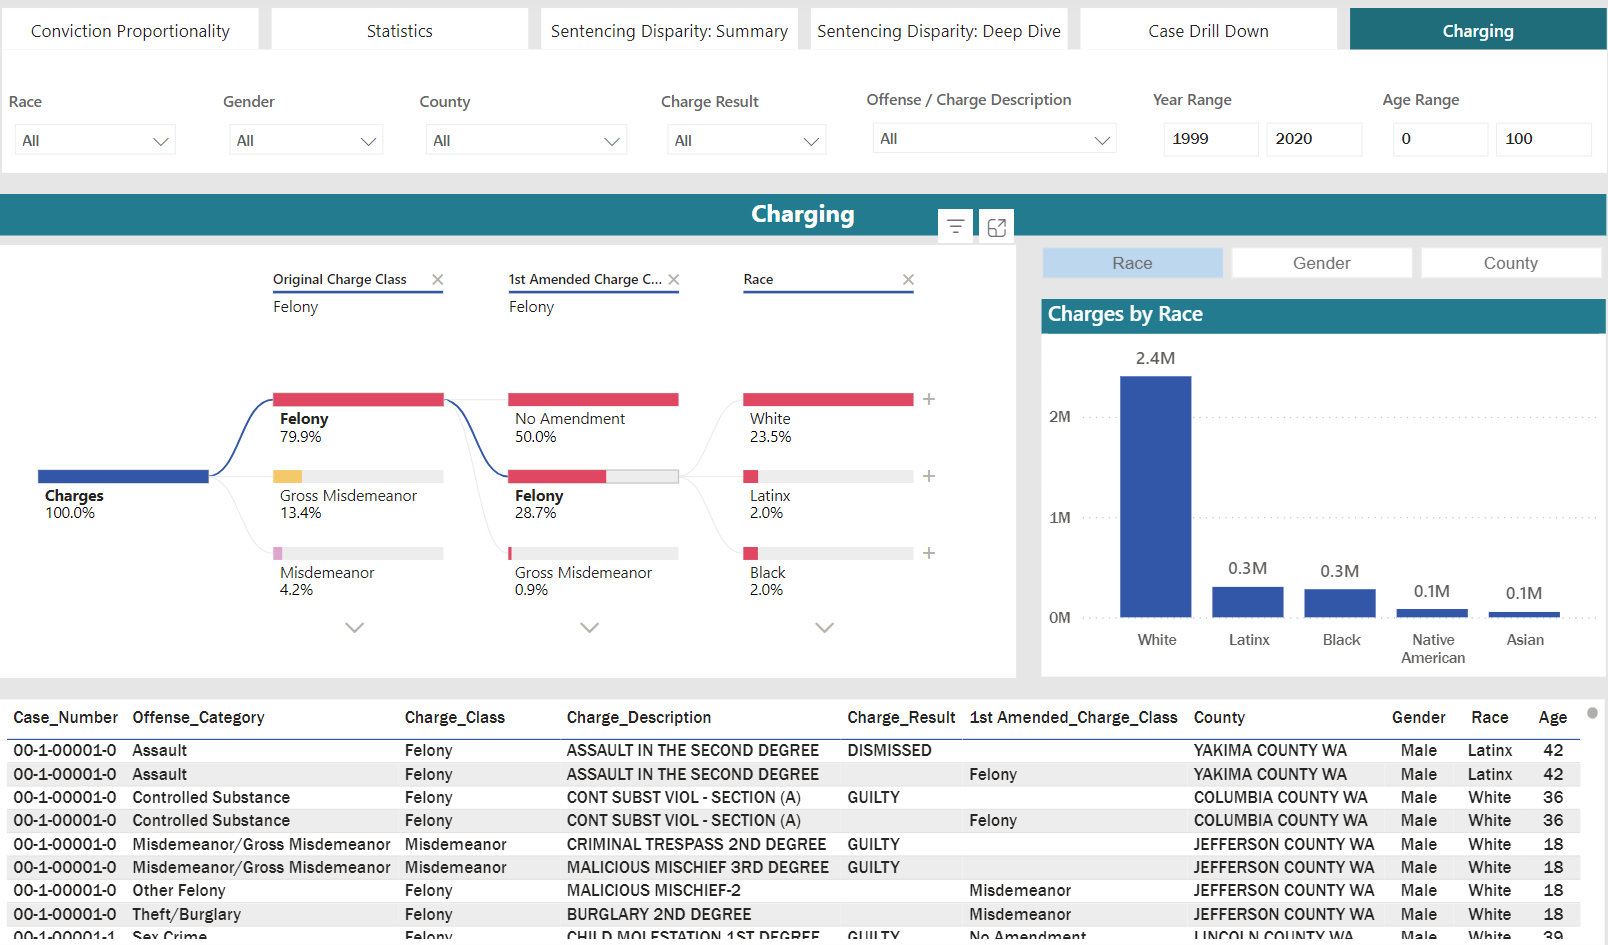
CFC data is available for the years July 1, 1999 - June 30, 2020. Outlier cases in the CFC data have been filtered out of AEJG's sentencing views (550 cases with sentences > 9998 months). Washington’s legislature and administrative agencies use CFC data to inform their understanding of caseloads and budgets. The data, available at WA Caseload Forecast Council, includes all adult felony cases in Washington Superior Courts. The CFC obtains their data, including demographics, from the forms prepared at each felony sentencing hearing.
The Washington State Administrative Office of the Courts (AOC) maintains information and records from court case management systems across Washington's non-unified courts, including the Judicial Information System (JIS), the Superior Court Management and Information System (SCOMIS), the Appellate Court System (ACORDS), and Odyssey. AOC uses the data to develop operational budgets, evaluate judicial system functionality, maintain the computer system that serves the entire court system, provide continuing judicial education, compile statewide court statistics, and provide information to the judicial community, other branches of the government, and the public. The AOC tracks data from points at all stages of felony cases filed in any of Washington's 39 superior courts, with the exception of King County.
Washington State Report Card Enrollment data includes enrollment counts for Washington K–12 schools reported by the Office of Superintendent of Public Instruction (OSPI) from the 2022-23 school year. It provides disaggregated data by school, district, and the state level and includes counts of students by the following groups: grade level, gender, race/ethnicity, and student programs and special characteristics. Enrollment data is sourced from the Comprehensive Education Data and Research Systems (CEDARS)..
This dataset includes student discipline data for the 2022–23 school year in Washington State. It is disaggregated by school, district, and state levels and includes counts and discipline rates by grade level, gender, race/ethnicity, and student programs or special characteristics (e.g., English Learners, Low-Income, Students with Disabilities). State Report Card Discipline data is publicly accessible and intended to support transparency and equity in school discipline practices.
ERDC maintains Washington State’s P20W data system, a longitudinal data warehouse that links de-identified data across preschool, K–12, postsecondary, and workforce sectors. The system supports research and policy analysis by integrating data from multiple state agencies, including the Office of Superintendent of Public Instruction (OSPI), State Board for Community and Technical Colleges (SBCTC), Washington Student Achievement Council (WSAC), Department of Children, Youth, and Families (DCYF), and Employment Security Department (ESD). ERDC provides dashboards, reports, and custom data requests to inform education and workforce outcomes across the state.
This data is used despite data limitations that can impact proportionality analysis and mask disparities. Please review the following documents for details.