Understaning the disparity in our court system is about understanding the relationship between the population at large and the rates of conviction and ranges of sentencing.
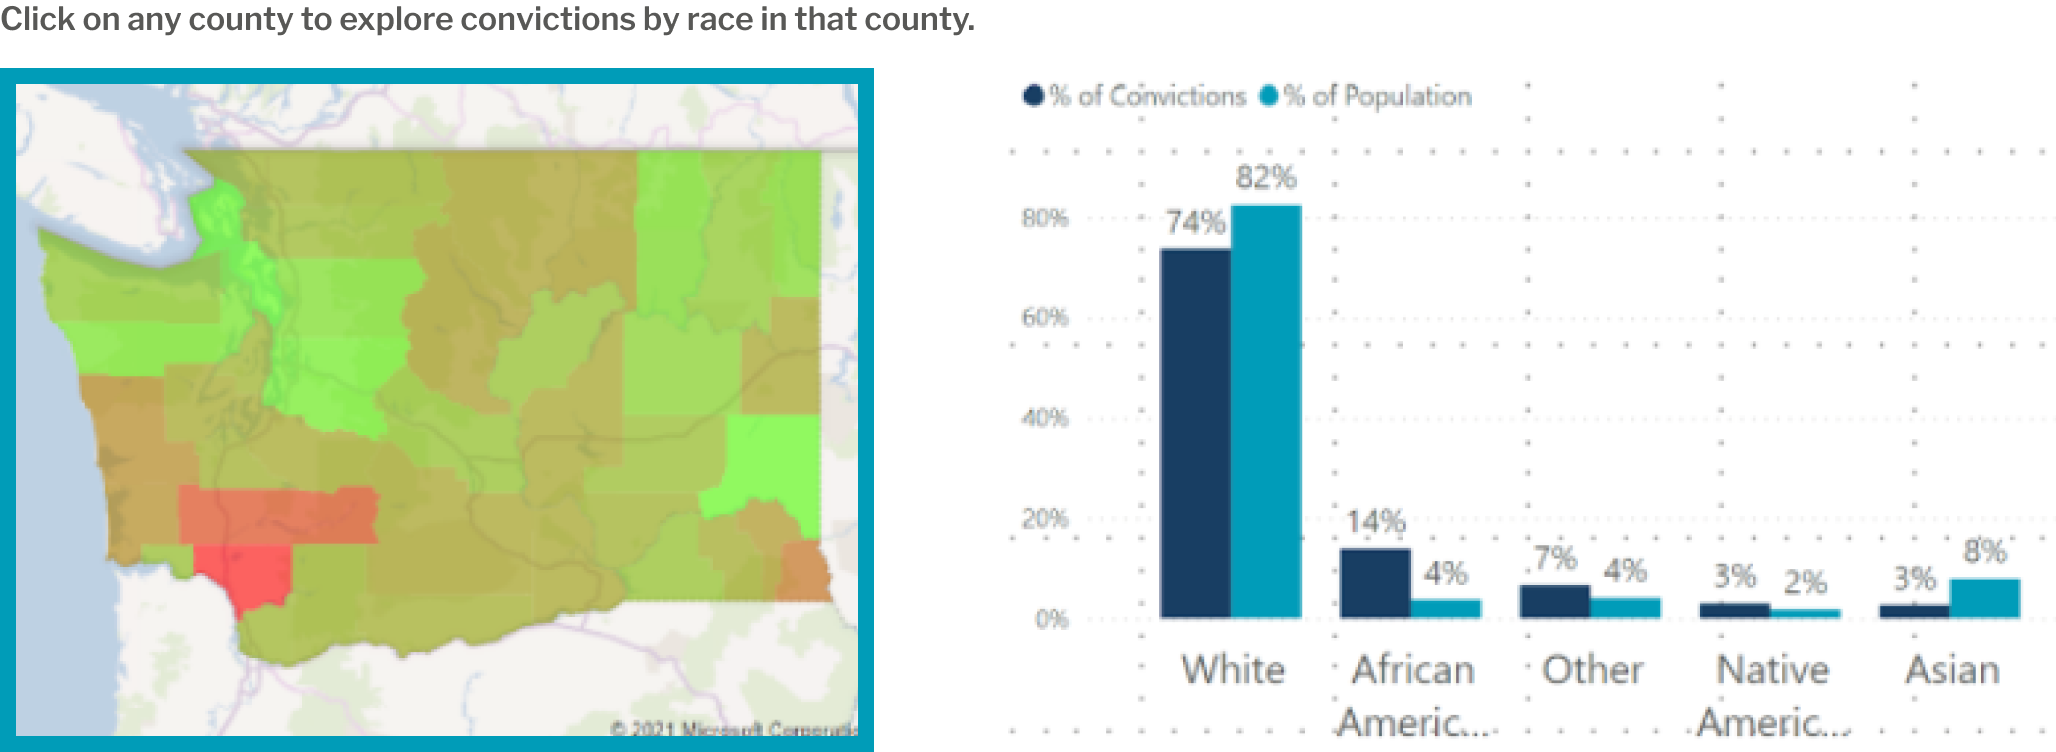
Conviction data can be compared to census data to explore the relationship between race, gender or locale vs. convictions rates.
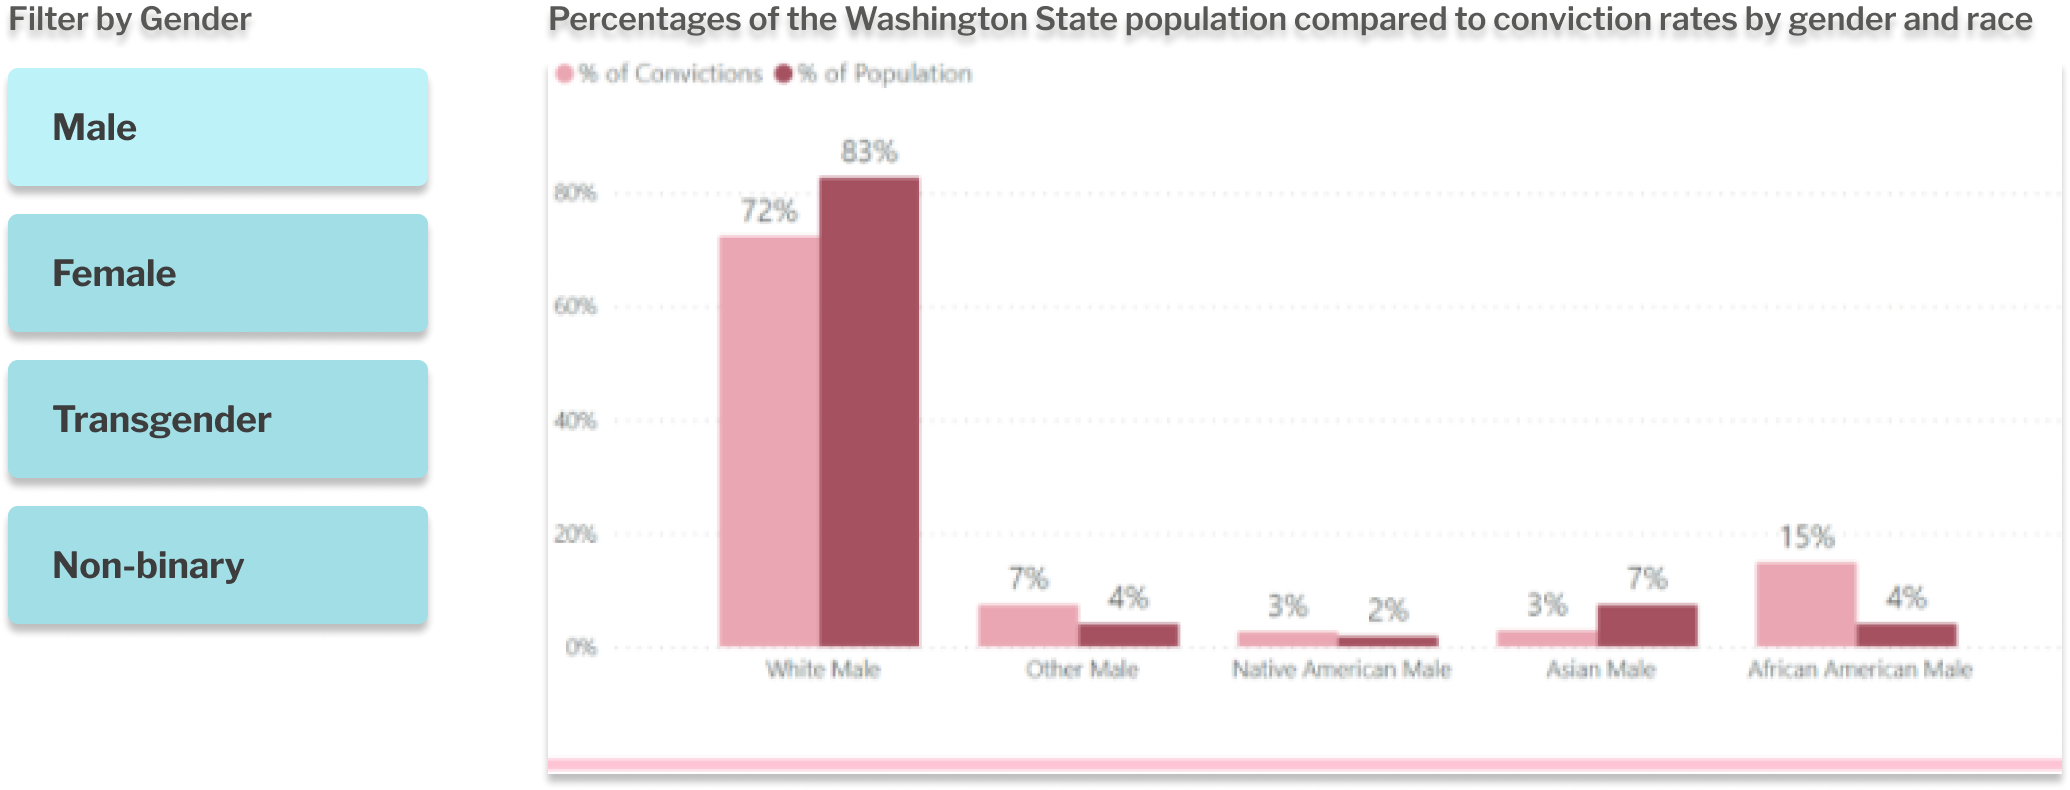
With these tools you can explore discrepancies between the population as a whole vs. the percentage of convicions. Are minority groups convicted at a higher rate than non-minorities? Does one’s gender relate to a higher or lower conviction rate?
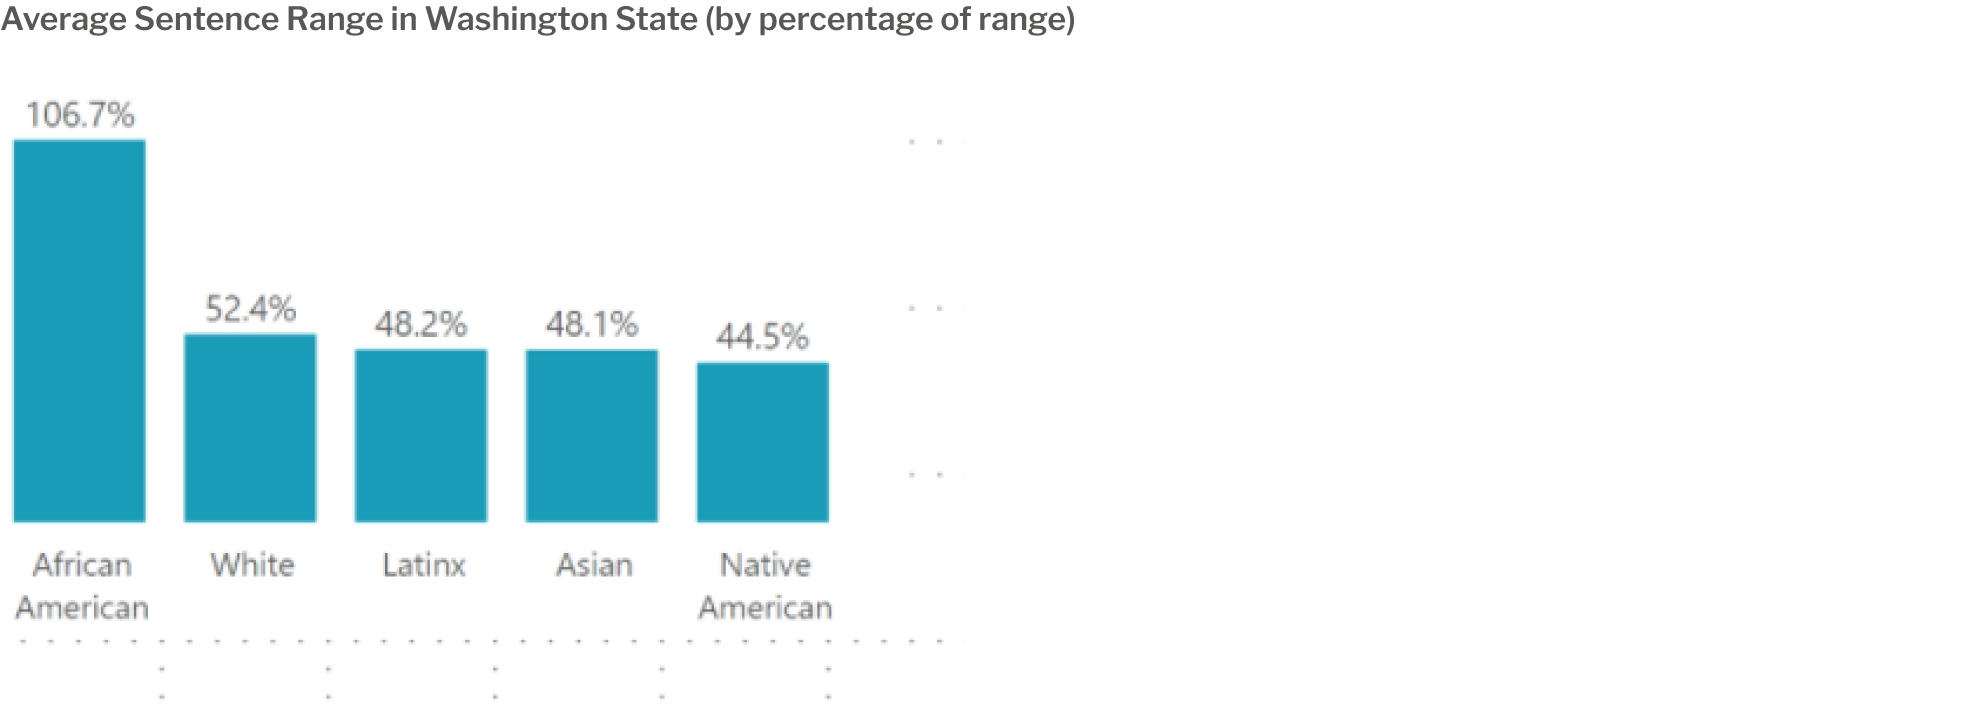
Not only do people of color receive on average more months but judges (at least for African Americans) tend to sentence at the higher end of the sentencing ranges.
A sentencing guideline commission has defined different sentence ranges for different crimes. This range gives judges discretion to sentence anywhere from the low end to the top end of the range. But mitigating factors can be introduced which can reduce or incresase that amount of time to below or above the standard range.
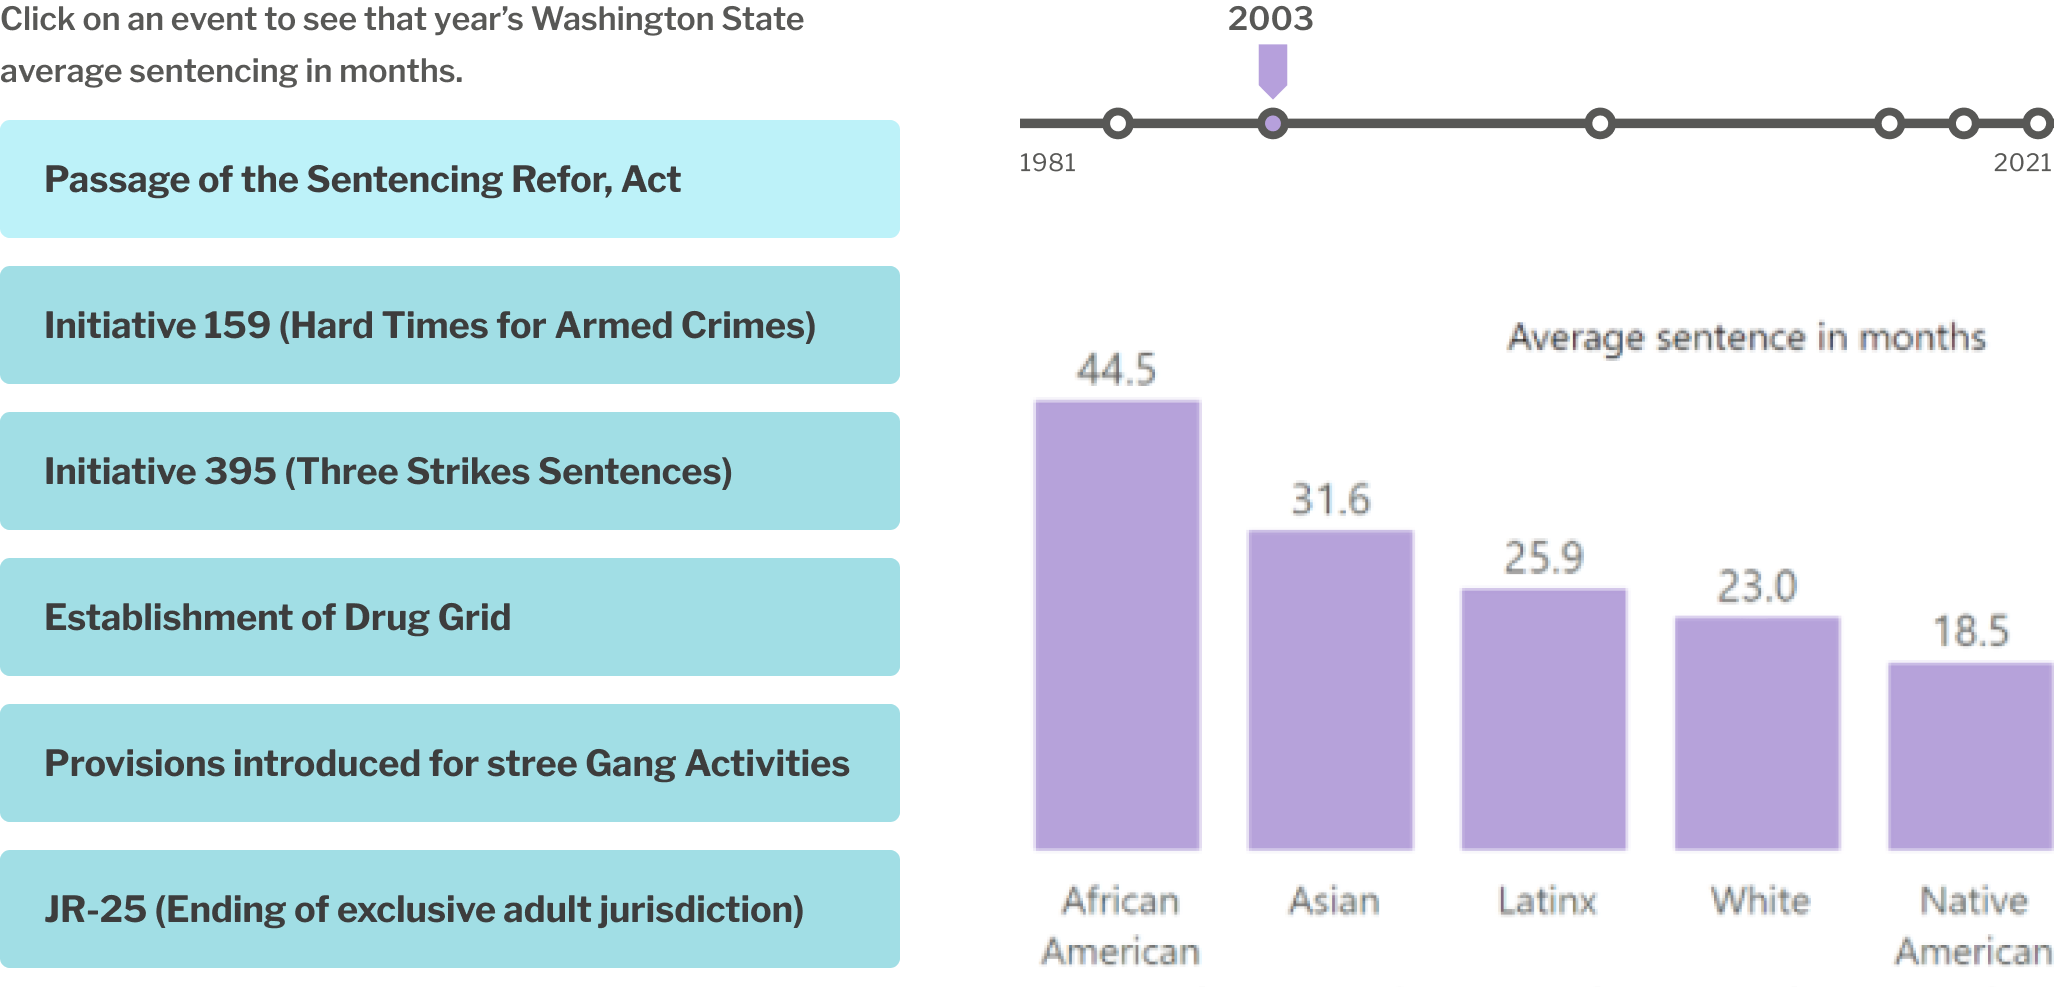
Explore how the average sentence has changed over the years compares to important events that were designed to have effect on crime and the courts.